





























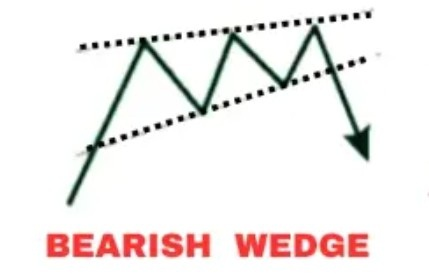
Bitcoin has recently formed a consolidation pattern characterized by converging trendlines where both upper and lower boundaries are sloping downward, though at different angles. This technical setup reflects a period of compression after an extended uptrend, where trading ranges have systematically narrowed over successive trading sessions. The upper trendline slopes more steeply than the lower one, creating a wedge-like formation that traders commonly monitor for directional breakouts. When price action compresses into such a pattern following a significant rally, market participants typically anticipate a decisive move in either direction, with the direction and momentum of the eventual breakout often indicating the conviction behind the next major price swing.
A breakdown below the lower trendline would suggest potential continuation to the downside, potentially invalidating the preceding uptrend and triggering stop-losses from traders who maintained bullish positions through the consolidation phase. Conversely, a breakout above the upper trendline could signal renewed upside momentum, though the downward slope of this resistance level means successive attempts to break above it would require increasingly strong buying pressure. For traders monitoring Bitcoin specifically, the key metric involves watching whether volume patterns support whichever direction price eventually chooses, as low-volume breakouts from consolidation patterns tend to attract reversals, while high-volume breaks typically show greater follow-through potential.
Ethereum has similarly shown price convergence patterns in recent sessions, reflecting broader market consolidation as traders reassess positioning following earlier volatility. On-chain metrics for Ethereum remain important context, with network activity levels and whale wallet movements providing clues about institutional interest during these compressed price ranges. The Ethereum network’s ongoing adoption across decentralized finance and NFT applications continues to provide fundamental narrative support, though near-term price discovery appears constrained by technical resistance and support levels that are narrowing into the described wedge formation.
🚀 Upgrade Your Trading Experience
Join Only Signals Subscription Harmonics Pro Trader Basic Harmonics Pro Trader Intermediate Harmonics Pro Trader AdvancedLitecoin and Solana have also participated in this recent consolidation phase, each displaying their own convergence patterns as broader cryptocurrency markets await catalysts for directional clarity. Litecoin’s positioning within its technical formation reflects its historical correlation with Bitcoin, though asset-specific developments in merchant adoption and network upgrades provide independent fundamental considerations. Solana’s consolidation comes amid continued focus on network stability improvements and ecosystem development, with traders monitoring both price action and the network’s technical performance metrics as relevant context.
Macro conditions affecting all four assets include interest rate expectations, broader risk-asset sentiment, and regulatory commentary that can influence cryptocurrency market direction independent of technical patterns. Traders watching these consolidation formations typically prepare contingency strategies for both potential directions, recognizing that the eventual breakout direction often determines the next intermediate trend. The period of narrowing ranges provides an opportunity for traders to identify their technical levels and risk management parameters before the market makes its next decisive move.