
Price action is where theory meets the candle. It is the discipline of reading raw price — candlesticks, support, resistance and structure — to confirm exactly when to act.
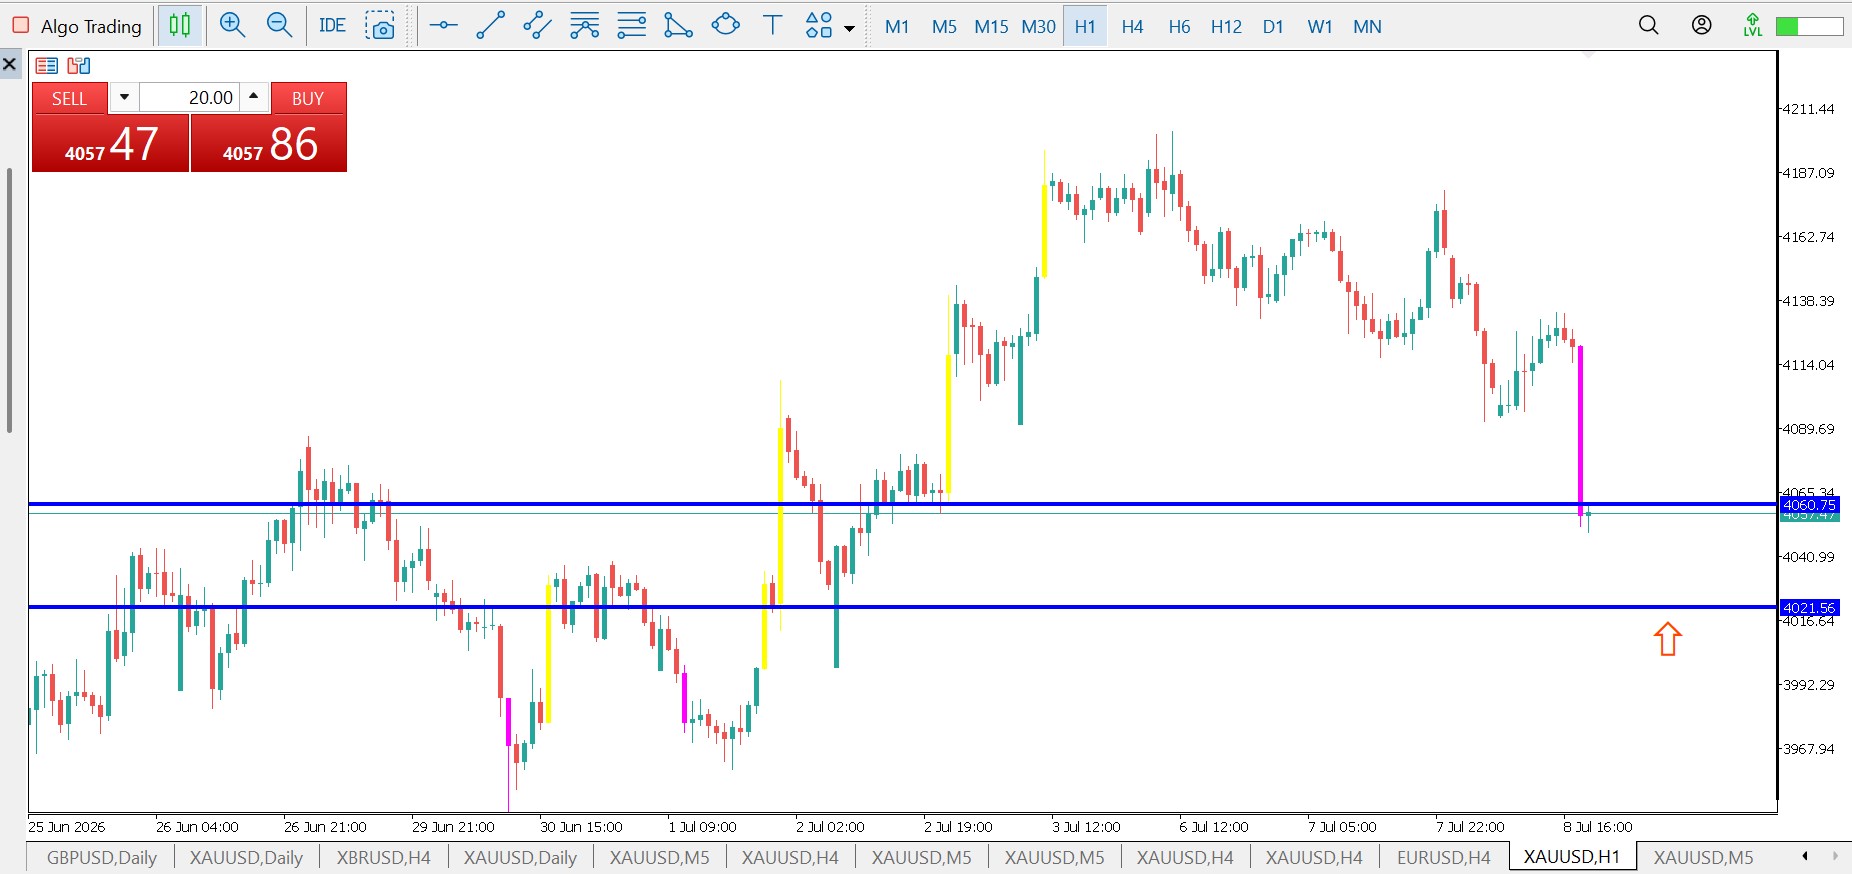
The origins: Japanese candlesticks
Candlestick charting grew out of Japanese rice markets and is traditionally linked to Munehisa Homma in the 18th century. It reached modern Western trading largely through Steve Nison, whose Japanese Candlestick Charting Techniques codified the patterns — dojis, engulfing bars, hammers and more.
Reading market structure
Beyond individual candles, price action is about structure: the sequence of highs and lows that defines a trend, and the support and resistance levels where price repeatedly reacts. Structure gives every candlestick its context.
Support, resistance and supply/demand
Levels where price has turned before tend to matter again. Reading how price behaves as it approaches these zones — rejection, absorption, breakout — is often the clearest signal the market gives.
How we apply price action
Price action is our final filter. When a harmonic zone, classic pattern and directional signal all align, the candlestick behaviour and structure at that level confirm the trigger and define the risk. We show this precise, level-by-level reading on live Gold, FX and crypto charts in our Videos section.
Watch it in action: reading price action live
We break down candlestick signals, market structure and supply/demand zones on the live charts. Explore the full library in our Videos section, which covers most of the technical setups we trade.
Frequently asked questions
What is price action trading?
Price action trading reads the market directly from price itself — candlesticks, support and resistance, and market structure — rather than relying only on indicators. It focuses on what buyers and sellers are actually doing at key levels.
Where do Japanese candlesticks come from?
Candlestick charting originated with Japanese rice traders and is often associated with Munehisa Homma in the 18th century. It was introduced to Western traders largely through Steve Nison, author of Japanese Candlestick Charting Techniques.
What is market structure?
Market structure is the framework of higher highs and higher lows (uptrend) or lower highs and lower lows (downtrend), together with the support and resistance levels that price respects. Reading structure tells us the context around any signal.
How does Harmonics Pro Trader use price action?
Price action refines our entries and exits. Once a harmonic zone, classic pattern and directional signal align, candlestick behaviour and structure at that level confirm the trigger. We demonstrate this level-by-level reading on live charts in our Videos section.
Educational content only. Nothing here is financial advice. Book attributions reference the author’s published works.