

Beginner Forex Trading Course
Learn forex trading from scratch. This free beginner course teaches you the fundamentals in the right order — the same foundations the Harmonics Pro Trader method is built on.
This free forex trading course is the complete Harmonics Pro Trader syllabus, organised into three levels — beginner, intermediate and advanced. New to trading? This beginner section takes you from “what is forex?” to placing your first confident trade. Across 13 structured lessons you will master the core concepts every successful trader relies on: how the market works, how to read charts, how to analyse price, how to manage risk, and how to control the emotions that make or break a trading account.
The Beginner Curriculum
13 Lessons to Build Your Trading Foundation
 01
01
What is Forex?
Forex (foreign exchange) is the global marketplace for buying and selling currencies, and it is the largest and most liquid financial market in the world, trading over $7 trillion a day. In this lesson you will learn what a currency pair is, how pips measure price movement, and how beginners place their first trade.
 02
02
Types of Forex Analysis
There are three core types of forex analysis: technical analysis (reading price and charts), fundamental analysis (economic data and interest rates), and sentiment analysis (crowd positioning). You will learn what each method reveals, how they overlap, and why combining all three leads to higher-probability trading decisions.
 03
03
Types of Trading Charts
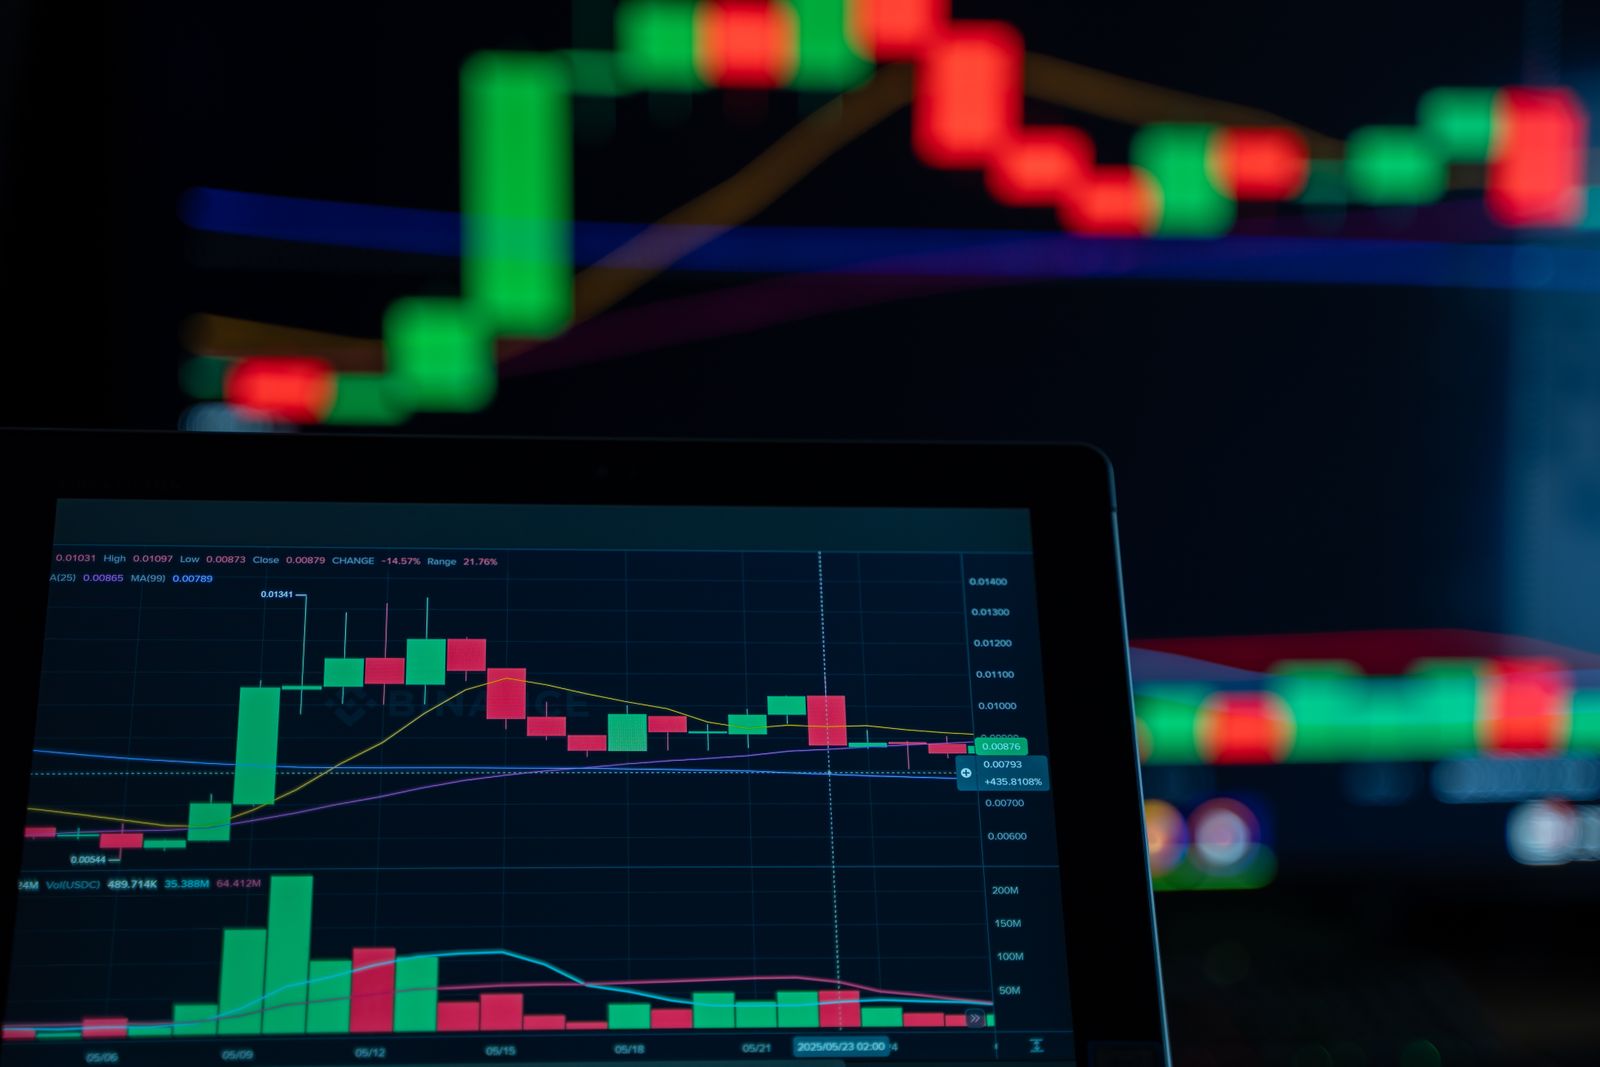
The three main trading charts are line charts, bar charts and candlestick charts. This lesson explains how each one displays price, and why candlestick charts are the preferred choice for most forex and crypto traders because they clearly show the open, high, low and close of every session.
 04
04
Support and Resistance
Support and resistance are the price levels where the market has repeatedly stopped and reversed, and they form the foundation of technical chart reading. You will learn how to identify these key zones, why they matter, and how to plan entries, stop-losses and targets around them.
 05
05
Fundamental Analysis
Fundamental analysis studies the economic forces that move currency values, including interest rates, inflation, employment data and central-bank policy. This lesson shows beginners how to read an economic calendar and understand why news events cause the forex market to move.
 06
06
Market Sentiment
Market sentiment is the overall attitude of traders toward a currency or market — whether the crowd is feeling greedy (bullish) or fearful (bearish). You will learn how to gauge sentiment using tools like the COT report and retail positioning, and how to avoid following the herd at the wrong time.
 07
07
Market Psychology
Markets move in repeating emotional cycles of optimism, euphoria, fear and panic. Understanding market psychology helps you recognise where price sits in that cycle, so you avoid buying at the top and selling at the bottom like the majority of inexperienced traders.
 08
08
Trader Psychology
Trader psychology is the mindset and emotional discipline needed to trade consistently. This lesson tackles fear, greed, revenge trading and FOMO, and gives beginners practical habits for sticking to a trading plan and managing losses without emotion.
 09
09
What Type of Trader Are You?
Every trader fits a style: scalping, day trading, swing trading or position trading. This lesson helps you discover which trading style suits your personality, available time and risk tolerance — a decision that shapes your entire strategy.
10
How to Use MetaTrader
MetaTrader (MT4 and MT5) is the industry-standard platform for forex trading. This hands-on lesson walks beginners through placing buy and sell orders, setting stop-loss and take-profit levels, adding indicators and reading charts inside MetaTrader.
 11
11
How to Choose a Forex Broker
Choosing a regulated forex broker protects your capital. This lesson explains what to check before opening an account — regulation and licensing, spreads and commissions, execution speed, and how easily you can deposit and withdraw your money.
 12
12
How to Avoid Trading Scams
Trading scams are common in the forex and crypto industry, from fake signal sellers to bogus fund managers promising guaranteed returns. This lesson teaches beginners the warning signs of a scam and simple rules to keep your money safe.
 13
13
Common Trading Mistakes
The most common beginner trading mistakes are overtrading, trading without a stop-loss, using too much leverage and chasing losses. This final beginner lesson shows you how to avoid the errors that wipe out most new trading accounts within months.
Ready for the next step?
Once these fundamentals click, our intermediate track opens the door to classic chart patterns and harmonic trading setups.
Beginner Forex Course – Frequently Asked Questions
What will I learn in the beginner forex trading course?
The beginner course covers 13 essential lessons: what forex is, the types of analysis and charts, support and resistance, fundamental analysis, market and trader psychology, choosing your trading style, how to use MetaTrader, choosing a regulated broker, avoiding trading scams, and the common mistakes new traders make.
Is this beginner trading course suitable for complete beginners?
Yes. The course starts with the absolute fundamentals — explaining what forex is and how price moves — and builds step by step, so no prior trading experience is required.
Do I need to know anything before starting?
No prior knowledge is needed. Each lesson is self-contained and progresses in a logical order, taking you from complete beginner to a solid understanding of how the forex market works.
What comes after the beginner level?
After completing the beginner lessons, traders move on to the intermediate level, which introduces classic chart patterns and harmonic trading setups built on the Harmonics Pro Trader method.
Intermediate Forex Trading Course
Move beyond the basics. This intermediate course turns knowledge into strategy — indicators, market structure, risk management and a trading plan you can actually follow.
Ready to go deeper in this free forex trading course? The intermediate section takes the fundamentals you learned as a beginner and builds them into a complete, repeatable process. Across 16 lessons you will master leverage and margin, the most useful indicators, market structure, and the risk-management discipline — position sizing, stop losses and profit targets — that separates consistent traders from the rest.
The Intermediate Curriculum
16 Lessons to Sharpen Your Edge
 01
01
How Does Margin Trading Work?
Margin trading lets you control a large position with a small deposit called margin, using leverage supplied by your broker. This lesson explains how leverage, margin, used margin and free margin work together — and why leverage magnifies both your profits and your losses.
02
Forex Brokers
Going deeper than the beginner lesson, here you compare broker types — market makers, STP and ECN — and learn how order execution, spreads, commissions and slippage affect the real cost of every trade you place.
03
Moving Averages
A moving average smooths price into a single flowing line that reveals the underlying trend. This lesson covers simple and exponential moving averages, how to read crossovers, and how traders use them for dynamic support and resistance.
 04
04
Popular Indicators
Indicators turn raw price into actionable signals. You will learn the most widely used tools — RSI, MACD, Bollinger Bands and Stochastics — what each one measures, and how to combine momentum and trend indicators without overloading your chart.
05
Pivot Points
Pivot points are calculated price levels that many traders watch for intraday support and resistance. This lesson shows you how pivots are worked out from the previous session and how to use them to plan entries, targets and stops.
 06
06
Market Environment
Not every strategy works in every market. This lesson teaches you to identify whether the market is trending or ranging, and to adapt your approach — and your indicators — to the environment you are actually trading in.
07
Currency Crosses
Currency crosses are pairs that do not include the US dollar, such as EUR/GBP or AUD/JPY. This lesson explains how crosses are priced, why they can offer cleaner trends, and what to watch for when trading them.
 08
08
Carry Trades
A carry trade earns the interest-rate difference between two currencies while you hold the position. This lesson explains how the carry works, which pairs suit it, and the risks when market sentiment turns against you.
 09
09
Trading the News
High-impact news releases can move the market violently in seconds. This lesson teaches you how to read an economic calendar, understand which events matter most, and manage the volatility and spreads that surround major announcements.
10
The U.S. Dollar Index
The U.S. Dollar Index (DXY) measures the dollar against a basket of major currencies and is a key barometer for the whole forex market. This lesson shows you how to use the DXY to confirm strength or weakness across your dollar pairs.
 11
11
Creating Your Own Trading Plan
A trading plan is your personal rulebook for entries, exits, risk and markets. This lesson walks you through building a plan that fits your style, so every decision you make at the chart is intentional rather than emotional.
 12
12
Keeping a Trading Journal
A trading journal turns your results into lessons. This lesson shows you what to record after every trade — setup, reason, emotion and outcome — and how reviewing your journal reveals the habits that help or hurt your edge.
13
Risk Management
Risk management is what keeps you in the game long enough to profit. This lesson covers the core rules — risking a small fixed percentage per trade, understanding drawdown, and protecting your capital above all else.
 14
14
Position Sizing
Position sizing decides how much you trade so a single loss never hurts too much. This lesson gives you a simple formula linking your account size, risk percentage and stop-loss distance to the exact lot size for each trade.
15
Entry Strategies and Stop Losses
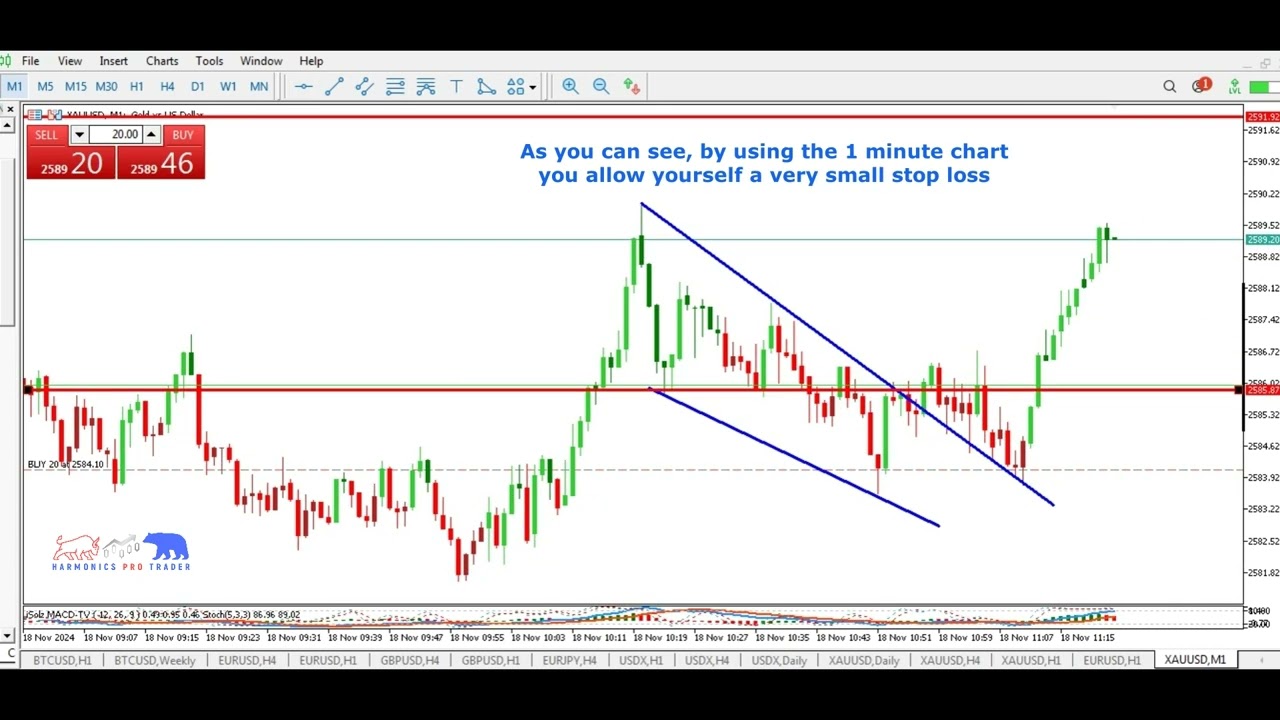
A good entry and a well-placed stop-loss define your risk before you ever profit. This lesson covers entry triggers, where to logically place your stop, and why your stop should be based on the chart rather than on hope.
16
Target Profits
Knowing where to take profit is as important as knowing where to enter. This lesson covers setting realistic targets, using risk-to-reward ratios, and techniques like partial closes and trailing stops to lock in your gains.
Take it to the next level
With strategy and risk under control, the advanced level unlocks pattern-based trading and the full Harmonics Pro Trader method.
Intermediate Forex Course – Frequently Asked Questions
What does the intermediate forex course cover?
The intermediate level builds on the basics with 16 lessons: margin and leverage, forex brokers, moving averages, popular indicators, pivot points, reading the market environment, currency crosses, carry trades, trading the news, the U.S. Dollar Index, building a trading plan, keeping a journal, risk management, position sizing, entry strategies and stop losses, and setting profit targets.
Should I finish the beginner lessons first?
Yes. The intermediate lessons assume you already understand charts, analysis and basic psychology from the beginner level, then take those foundations into practical strategy and risk management.
Will this level teach me risk and money management?
Yes. Several intermediate lessons focus specifically on protecting your capital — risk management, position sizing, stop losses and profit targets — which are the skills that keep traders in the game long term.
What comes after the intermediate level?
After intermediate, the advanced level moves into pattern-based and strategy lessons built around the Harmonics Pro Trader method, including advanced harmonic setups.
The advanced level of this free forex trading course is where technical skills come together into a complete trading method. Across 23 in-depth lessons you will learn to read Japanese candlesticks and price action, apply Fibonacci and harmonic patterns, align multiple timeframes, calculate confluence, manage risk like a professional and understand the psychology behind every market move. These lessons build directly on the beginner and intermediate levels and prepare you to trade harmonics effectively across any market.
23 Lessons to Master Professional Trading
 01
01
Japanese Candlesticks
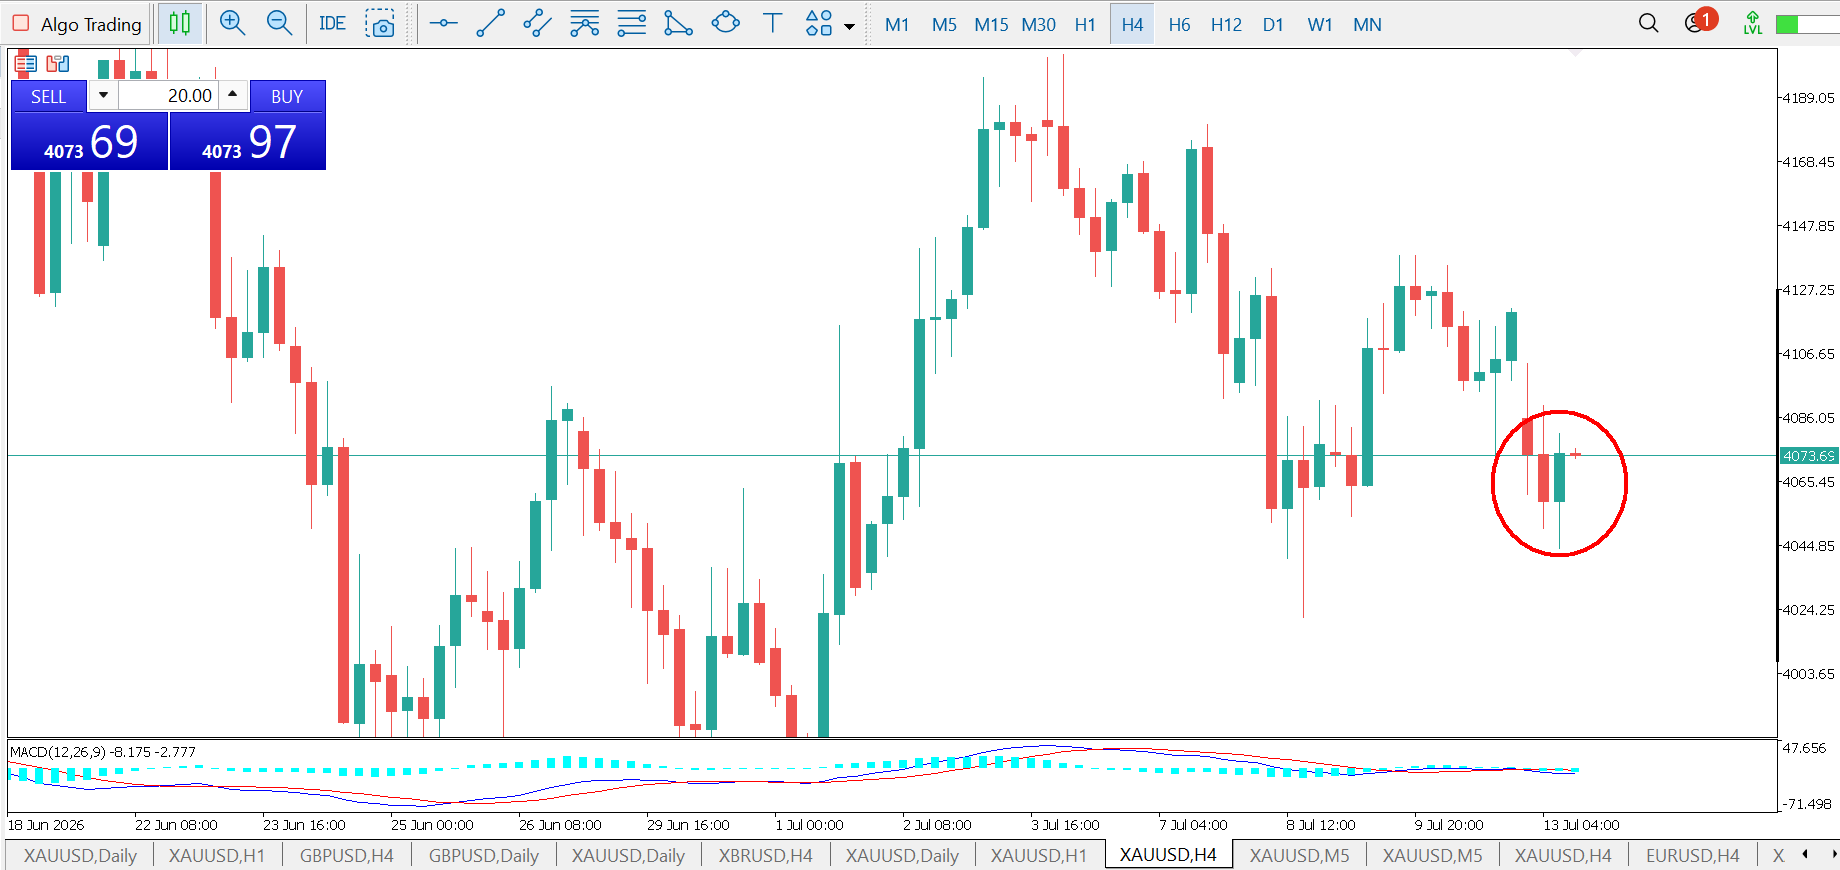
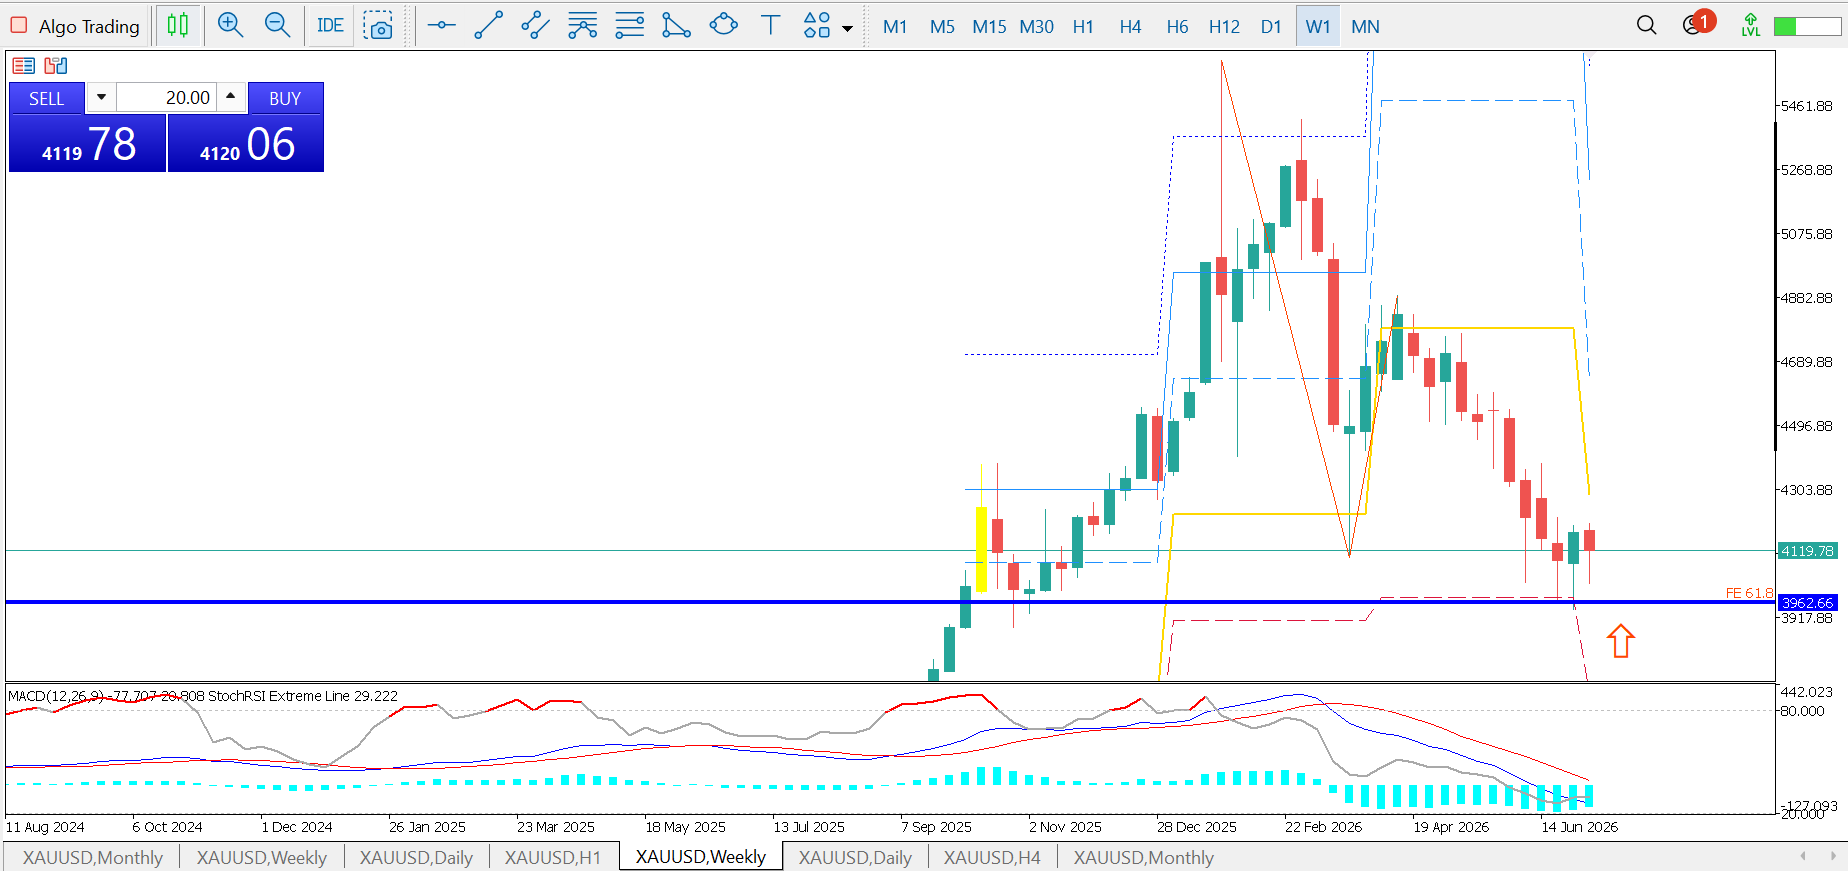
Japanese candlesticks encode the open, high, low and close of every session into a single visual, and reading them is the foundation of advanced price analysis. In this lesson you learn to identify reversal and continuation formations such as engulfing bars, dojis, hammers and shooting stars so you can time entries with confidence.
 02
02
Fibonacci
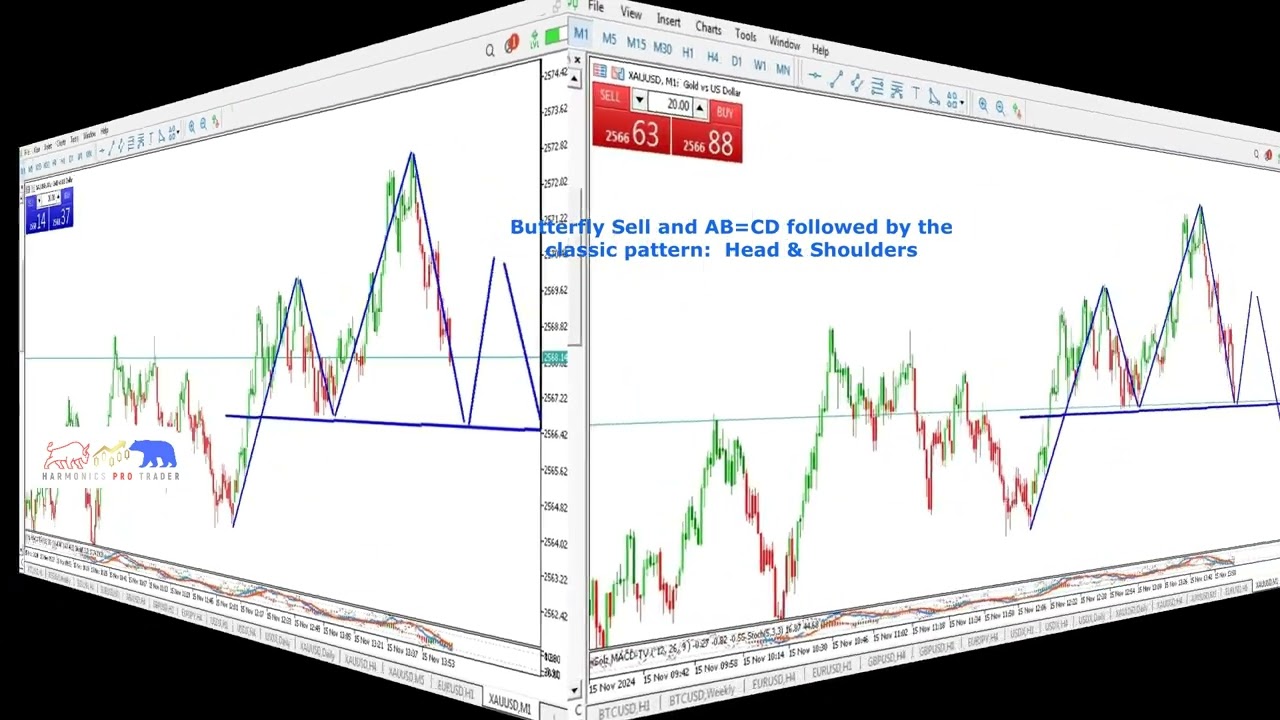
Fibonacci retracement and extension levels help traders locate where a pullback is likely to end and where a trend may exhaust. We show you how to anchor Fibonacci tools correctly, combine the 0.382, 0.500, 0.618 and 0.786 ratios with structure, and turn these levels into precise entries and profit targets.
 03
03
Chart Patterns: Harmonic and Classic
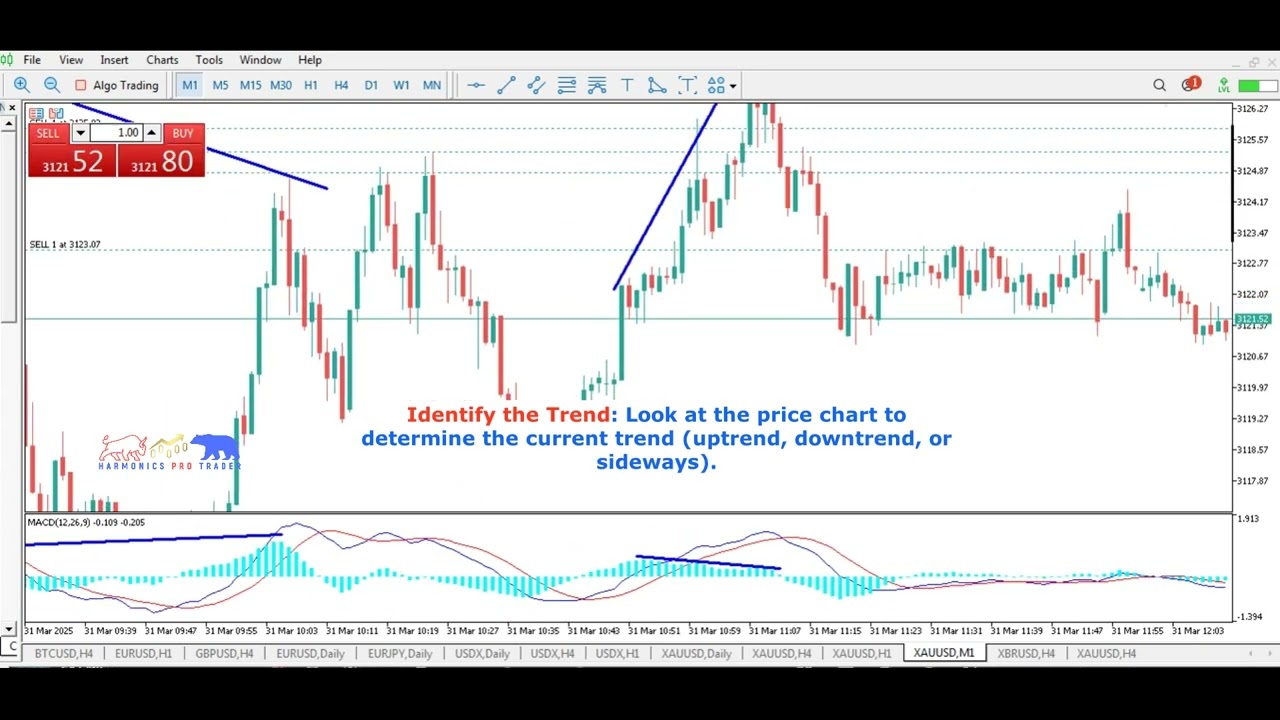
Classic patterns like head and shoulders, triangles and flags describe crowd behaviour, while harmonic patterns such as the Gartley, Bat, Butterfly and Crab use Fibonacci ratios to define precise reversal zones. This lesson teaches you to recognise both families and trade them with defined risk.
 04
04
Trading Divergences
Divergence occurs when price and an oscillator such as RSI or MACD move in opposite directions, often warning that a trend is losing strength. Learn to spot regular and hidden divergence, confirm it with structure, and use it to anticipate reversals and continuations before they appear on price alone.
 05
05
Market Environment
Every strategy performs differently depending on whether the market is trending, ranging or volatile. This lesson helps you classify the current market environment so you can select the right tools, adjust expectations, and avoid applying trend tactics in a sideways market or vice versa.
 06
06
Multiple Timeframe Analysis
Multiple timeframe analysis means aligning the higher timeframe trend with lower timeframe entries. You will learn a top-down workflow that reads context on the daily and 4-hour, then refines timing on the 1-hour and 15-minute, so your trades work with the dominant flow rather than against it.
 07
07
Intermarket Correlations
Currencies, commodities, bonds and equities move in relationships that repeat over time. Understanding intermarket correlations, such as the link between the U.S. dollar, gold and oil, lets you confirm setups, avoid doubling up on the same risk, and read the bigger macro picture.
 08
08
Equities and FX Trading
Trading equities and foreign exchange share many technical principles but differ in hours, drivers and volatility. This lesson compares the two markets, explains how index performance can spill into currency flows, and shows how a technical trader can operate across both.
 09
09
Creating a Trading System
A trading system turns discretionary ideas into repeatable, testable rules. Here you build a complete system covering setup, entry, stop, target and position size, then define the conditions that must be true before you take a trade so results become measurable and consistent.
10
Risk Management 2
Building on the basics, advanced risk management covers correlated exposure, drawdown control, expectancy and how to size across a portfolio of trades. Learn to protect capital through losing streaks and to scale risk sensibly as your account grows.
 11
11
Entry Strategies: Split, Multi-Entry, Scale In and Out
Instead of one all-or-nothing entry, advanced traders split positions, add on confirmation and scale out at targets. This lesson explains how to layer multiple entries, average intelligently within your risk limit, and manage partial exits to lock in profit while letting winners run.
 12
12
Trend Versus Direction
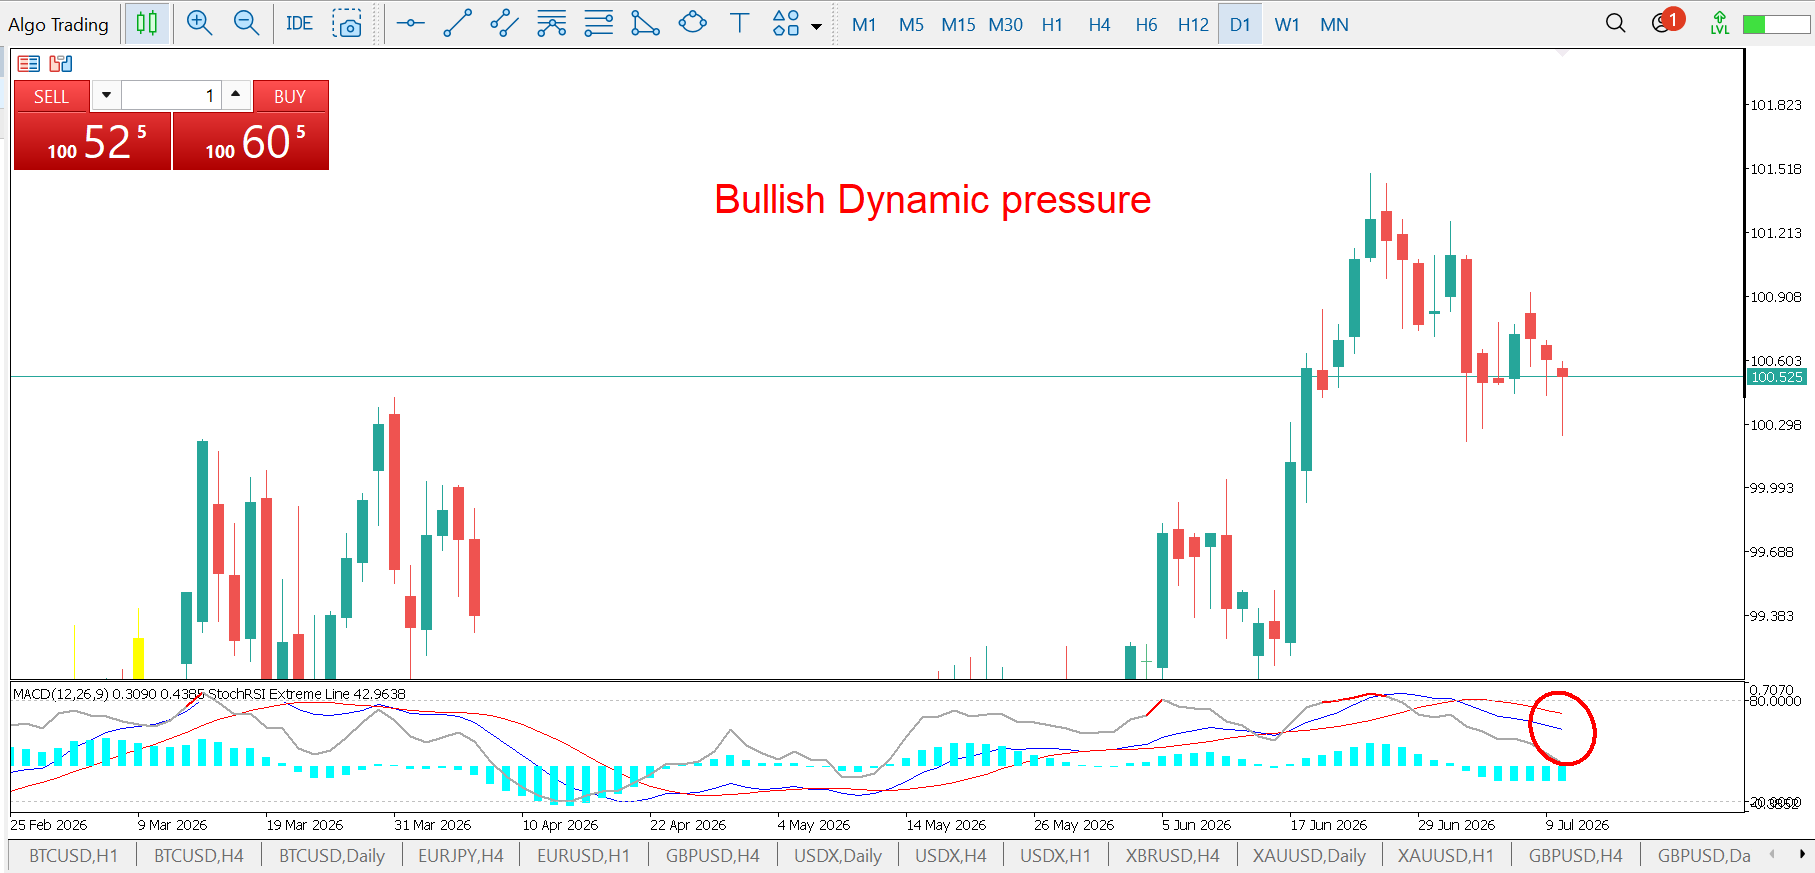
Trend and direction are not the same thing: a market can drift lower for days inside a larger uptrend. Learn to separate the dominant trend from short-term directional noise so you stay on the right side of the bigger move while trading the swings within it.
 13
13
Directional Patterns
Directional patterns signal when momentum is about to expand in one clear direction. This lesson covers breakouts, thrust bars, momentum candles and continuation structures that tell you a move has conviction, helping you enter early and ride the impulse.
 14
14
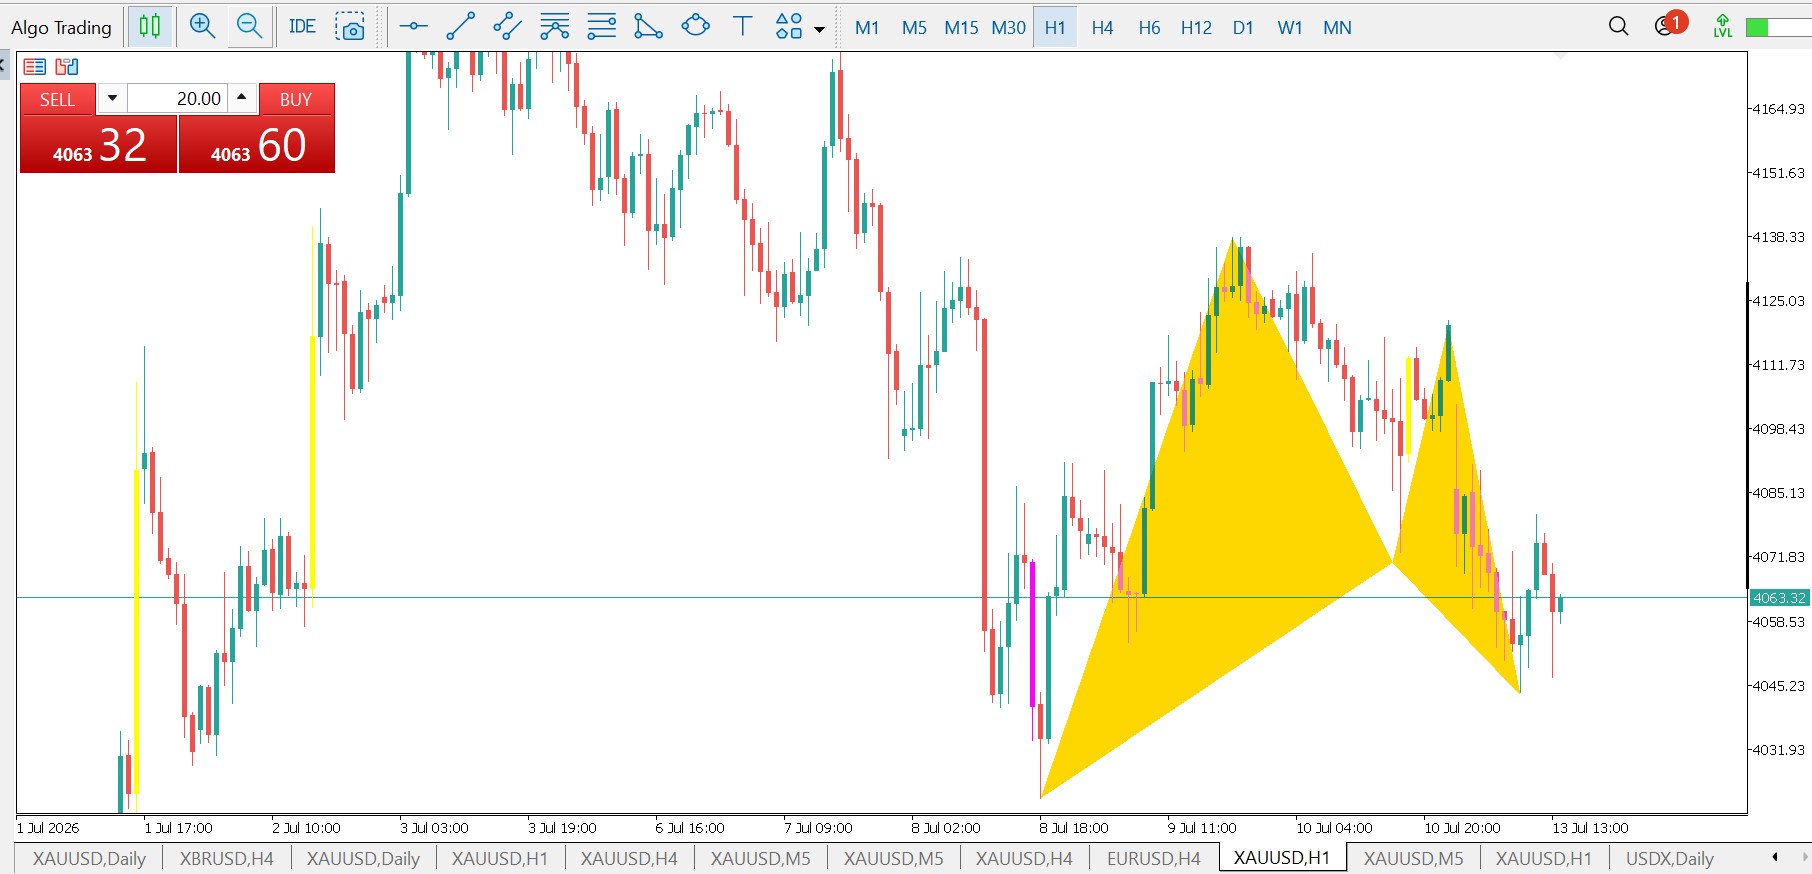
Using Harmonics Effectively for All Trading
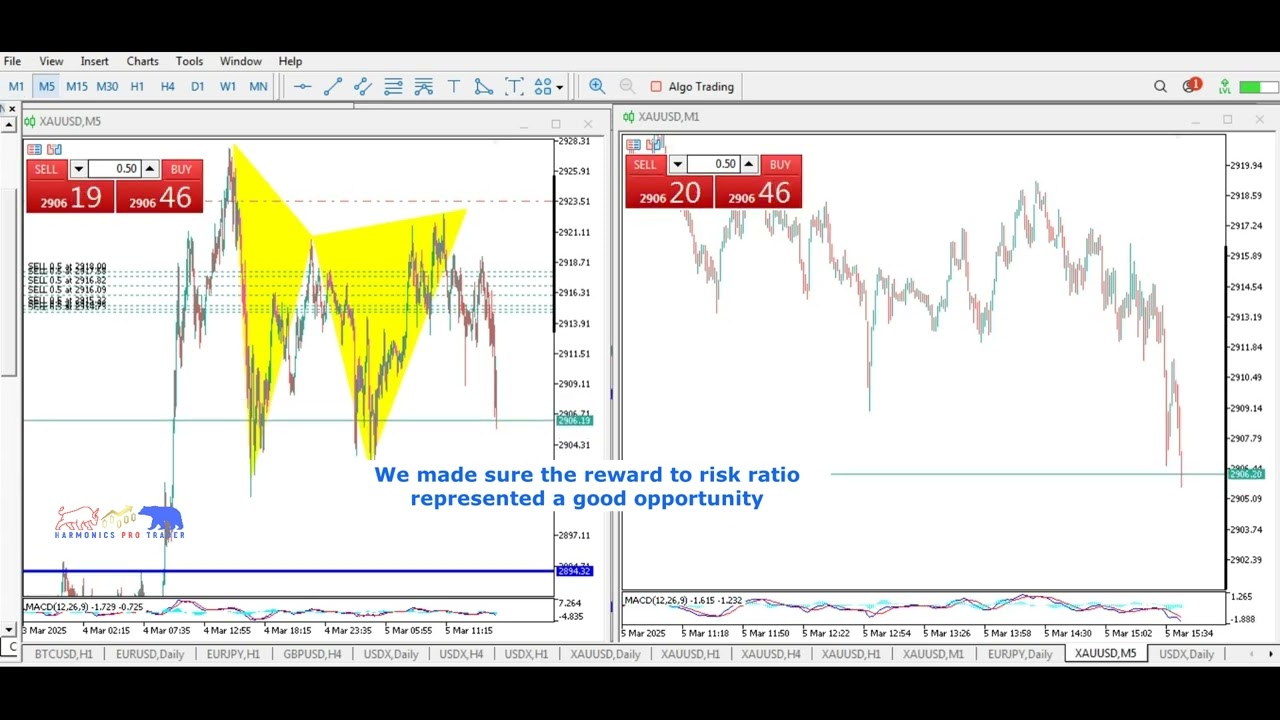
Harmonic trading is the specialty of Harmonics Pro Trader. Here you learn to apply harmonic patterns across any market and timeframe, validate the pattern with Fibonacci confluence, and manage the trade from the potential reversal zone through to target with disciplined risk.
 15
15
Combining Technicals
No single indicator is enough on its own. This lesson shows how to combine structure, moving averages, momentum and volume into a coherent read, filtering out conflicting signals so that only high-probability setups pass your checklist.
 16
16
Order Types
Choosing the right order type is part of the edge. Learn the difference between market, limit, stop, stop-limit and trailing orders, when each is appropriate, and how correct order placement improves fills, controls slippage and enforces your plan automatically.
 17
17
Confluence Calculation
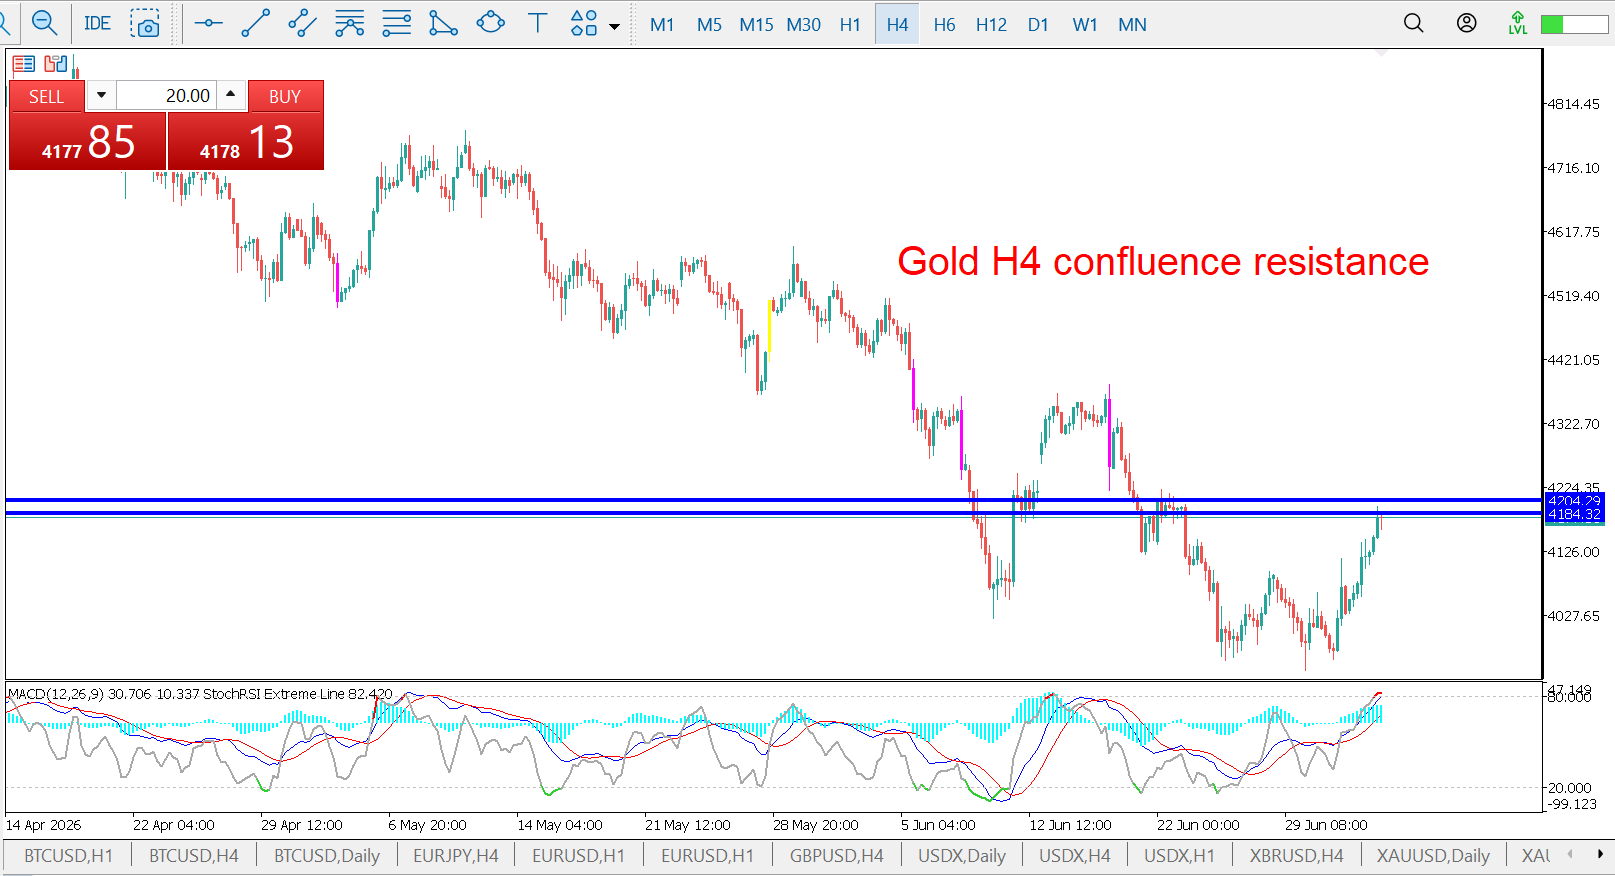
Confluence is where several independent signals point to the same price zone at the same time. This lesson teaches you to stack Fibonacci levels, structure, harmonics and moving averages to score a setup, so you commit capital only where the evidence agrees.
 18
18
Agreement Levels
Agreement levels rank how many factors support a trade before you take it. We show you how to grade setups from low to high agreement, size positions according to that grade, and pass on trades where the market is sending mixed messages.
 19
19
Market Mechanics: Wash and Rinse Pattern
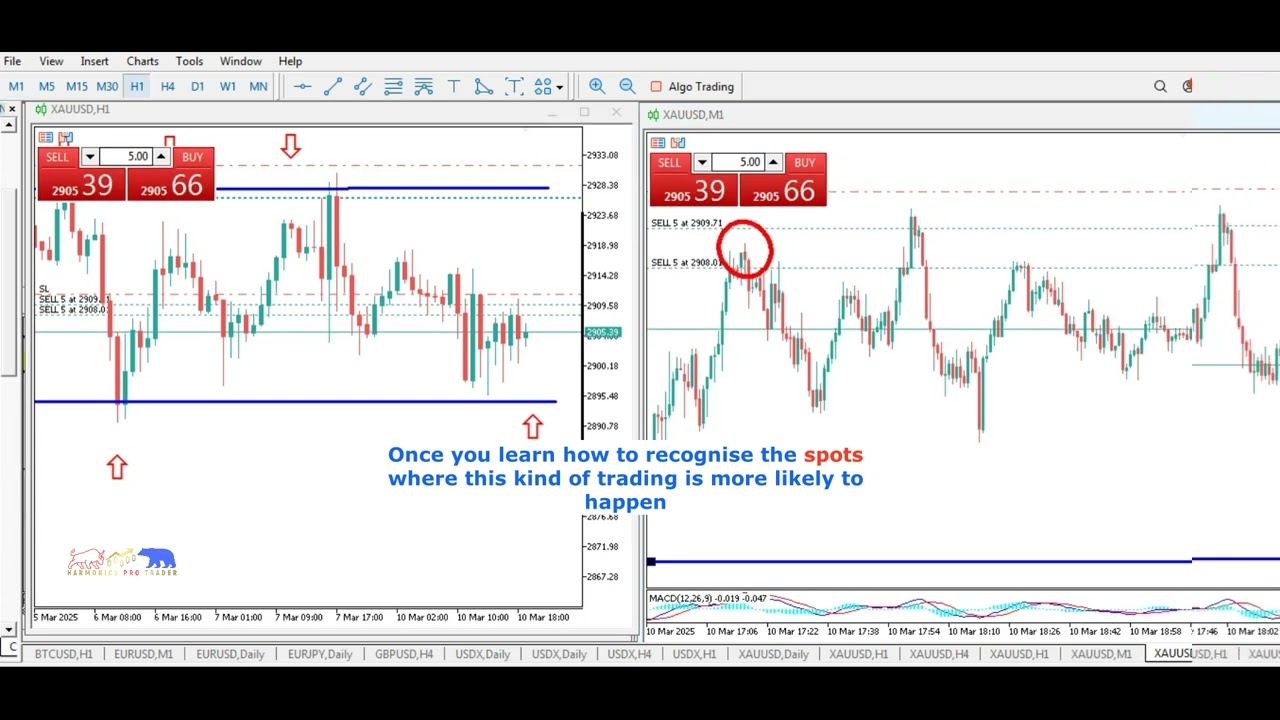
The wash and rinse, or stop hunt, is how larger players shake weak hands out before the real move. This lesson reveals the mechanics behind these liquidity grabs so you recognise the trap, protect your stops, and even position alongside the smart money.
 20
20
Interpretation of Price Action
Price action is the purest form of market data. Learn to read bars, wicks, swing points and market structure directly, interpreting what buyers and sellers are doing in real time without relying on lagging indicators.
 21
21
Psychology Behind Market Moves
Markets move because of fear, greed and the herd behaviour of thousands of participants. This lesson explains the psychology driving breakouts, panics and reversals so you can anticipate crowd reactions instead of being caught in them.
 22
22
Recognizing Trends
Trend recognition is a core skill that keeps you trading with the odds. Learn to define trends objectively through higher highs and higher lows, identify when a trend is maturing, and know the difference between a healthy trend and one that is breaking down.
 23
23
Retracement or Reversal
One of the hardest questions in trading is whether a pullback is a buying opportunity or the start of a full reversal. This closing lesson gives you a framework using structure, Fibonacci, divergence and volume to judge the difference and act decisively.

Advanced Course — Frequently Asked Questions
What will I learn in the Advanced forex trading course?
The advanced level covers Japanese candlesticks, Fibonacci, harmonic and classic chart patterns, divergences, multiple timeframe analysis, intermarket correlations, building a complete trading system, advanced risk management, order types, confluence and agreement levels, market mechanics, price action interpretation and trading psychology.
Do I need to complete the beginner and intermediate levels first?
We strongly recommend it. The advanced lessons assume you already understand charts, indicators, brokers and basic risk management from the beginner and intermediate levels, and build directly on those foundations toward a complete, rule-based trading approach.
What are harmonic patterns and why do they matter?
Harmonic patterns are precise chart formations defined by Fibonacci ratios, such as the Gartley, Bat, Butterfly and Crab, that identify high-probability reversal zones. They are the core specialty of Harmonics Pro Trader and are taught here so you can trade them across any market with clearly defined risk.
How do I know when a pullback is a retracement or a full reversal?
The advanced course teaches a framework combining market structure, Fibonacci levels, momentum divergence and volume to judge whether price is likely to resume the trend or reverse, so you can make that decision objectively rather than guessing.