




























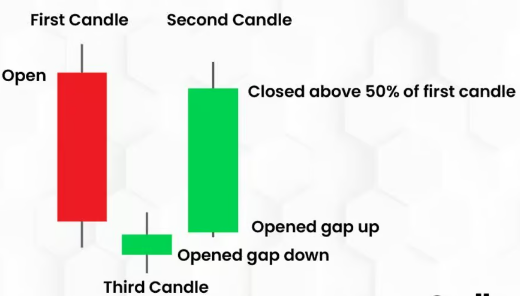
The cryptocurrency market has recently displayed a textbook reversal pattern that has captured the attention of technical traders across major assets including Bitcoin, Ethereum, Litecoin, and Solana. The three-candle formation described—a long bearish candle followed by a gap-down continuation and then a strong bullish close—represents what many traders recognize as a potential capitulation and recovery structure. This pattern often emerges when selling pressure exhausts itself and buyers step in to reclaim lost ground, though its predictive reliability depends heavily on surrounding context including support levels, volume profile, and broader market conditions.
Bitcoin and Ethereum, as the two largest cryptocurrencies by market capitalization, have shown particular sensitivity to this reversal signal. Bitcoin’s ability to close substantially above the open of the initial bearish candle suggests that bulls have regained control at certain price levels, potentially invalidating lower targets that bears had established during the decline. Ethereum has followed a similar trajectory, though with varying momentum depending on whether capital is rotating between the two assets or flowing into or out of the broader cryptocurrency sector. Both assets remain sensitive to macroeconomic factors including Federal Reserve policy expectations, inflation data, and traditional equity market performance, which often serve as leading indicators for digital asset demand.
Litecoin and Solana offer different perspectives on market structure. Litecoin, historically viewed as more correlated with Bitcoin’s longer-term trends, may be consolidating within a range as this reversal pattern develops, while Solana—a higher-beta asset prone to sharper moves—could be signaling renewed interest in risk-on positioning if this bullish close holds. On-chain metrics provide additional context for evaluating whether this reversal represents genuine accumulation or merely a technical bounce. Metrics such as exchange inflows, whale wallet movements, and network activity levels can indicate whether institutional or retail participants are driving the recovery, though interpreting these signals requires caution and consideration of time-frame differences.
🚀 Upgrade Your Trading Experience
Join Only Signals Subscription Harmonics Pro Trader Basic Harmonics Pro Trader Intermediate Harmonics Pro Trader AdvancedTraders are closely monitoring whether the bullish candle’s close represents a genuine breakdown of the prior downtrend or a liquidity-grabbing move designed to trap new longs before another decline. Support and resistance levels become critical reference points in this analysis. If price holds above the halfway point of the initial bearish candle on subsequent closes, the reversal interpretation gains credibility. Conversely, if price retreats below that level, the pattern may be recharacterized as a failed reversal or a bear trap that ultimately continues the downtrend.
Volume analysis during this three-candle sequence provides crucial confirmation data. A gap-down on declining volume followed by a bullish candle on expanding volume would suggest genuine institutional buying pressure rather than retail panic-buying. Conversely, declining volume on the bullish close might indicate weak conviction and limited follow-through potential. The interaction between these price patterns and broader market conditions—including yield curve positioning, currency strength, and corporate earnings cycles—ultimately determines whether this reversal establishes a new short-term trading range or marks the beginning of a more substantial recovery across digital assets.