





























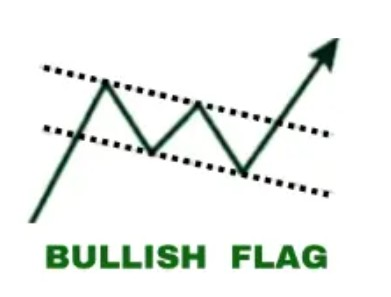
Bitcoin has recently entered a consolidation phase following a strong uptrend that captured the attention of institutional and retail traders alike. The price action currently trades within a sloped rectangular pattern, characterized by a gently declining upper trendline and a relatively flat lower boundary. This technical formation contains smaller intraday swings and represents a period of equilibrium where buyers and sellers are reassessing their positions. Traders monitoring Bitcoin’s structure are particularly focused on whether the asset will break above the declining upper resistance or slip below the lower support, as either scenario would provide directional clarity. The consolidation itself is not uncommon after significant rallies, and many technical analysts view such ranges as gathering periods before the next substantial move.
Ethereum has similarly displayed consolidation behavior, though its range differs slightly in steepness and volatility characteristics compared to Bitcoin. The Ethereum blockchain continues to process significant transaction volume, and on-chain metrics such as active addresses and exchange inflows remain relevant indicators for traders evaluating sentiment. The second-largest cryptocurrency by market capitalization tends to move in correlation with Bitcoin during macro risk-on or risk-off environments, yet ETH-specific catalysts such as network upgrades, staking participation rates, and institutional adoption developments can occasionally drive independent price action. Traders watching Ethereum are monitoring both its technical boundaries and the broader Ethereum ecosystem metrics to anticipate directional breakouts.
Litecoin and Solana present different technical and fundamental narratives within the current market environment. Litecoin, often characterized as a smaller-cap alternative to Bitcoin, has maintained its position as a store-of-value narrative asset while exhibiting consolidation patterns similar to those observed in Bitcoin and Ethereum. Solana, conversely, continues to track developer activity, network throughput, and ecosystem growth metrics that distinguish it within the altcoin space. Both assets trade within their own technical ranges, and breakouts from these consolidation zones would signal potential resumption of prior trends or reversal patterns depending on the direction of the break.
🚀 Upgrade Your Trading Experience
Join Only Signals Subscription Harmonics Pro Trader Basic Harmonics Pro Trader Intermediate Harmonics Pro Trader AdvancedMacro context remains crucial for understanding cryptocurrency price behavior during this consolidation period. Traditional financial markets, interest rate expectations, and macroeconomic data continue to influence risk appetite across digital assets. On-chain analysis reveals important details such as whale accumulation patterns, exchange reserve levels, and movement of coins from long-term holders. These metrics help traders gauge whether consolidation is occurring amid institutional buying, retail indecision, or distribution phases. The slope of consolidation ranges—particularly declining upper boundaries—can suggest subtle bearish pressure even within sideways price action, while flat lower boundaries indicate strong support floors.
Traders across all four assets are watching for a definitive break above the upper consolidation boundaries as a signal for trend resumption, which would represent a bullish confirmation. Conversely, breaks below the lower support levels would trigger stop-losses and potentially accelerate downside moves. Volume analysis during consolidation periods proves essential, as low-volume ranges that suddenly spike on directional breaks often indicate stronger conviction moves. The current technical setup across Bitcoin, Ethereum, Litecoin, and Solana provides multiple trading scenarios, making pattern recognition and risk management critical components of any trading approach during this period of price equilibrium.