





























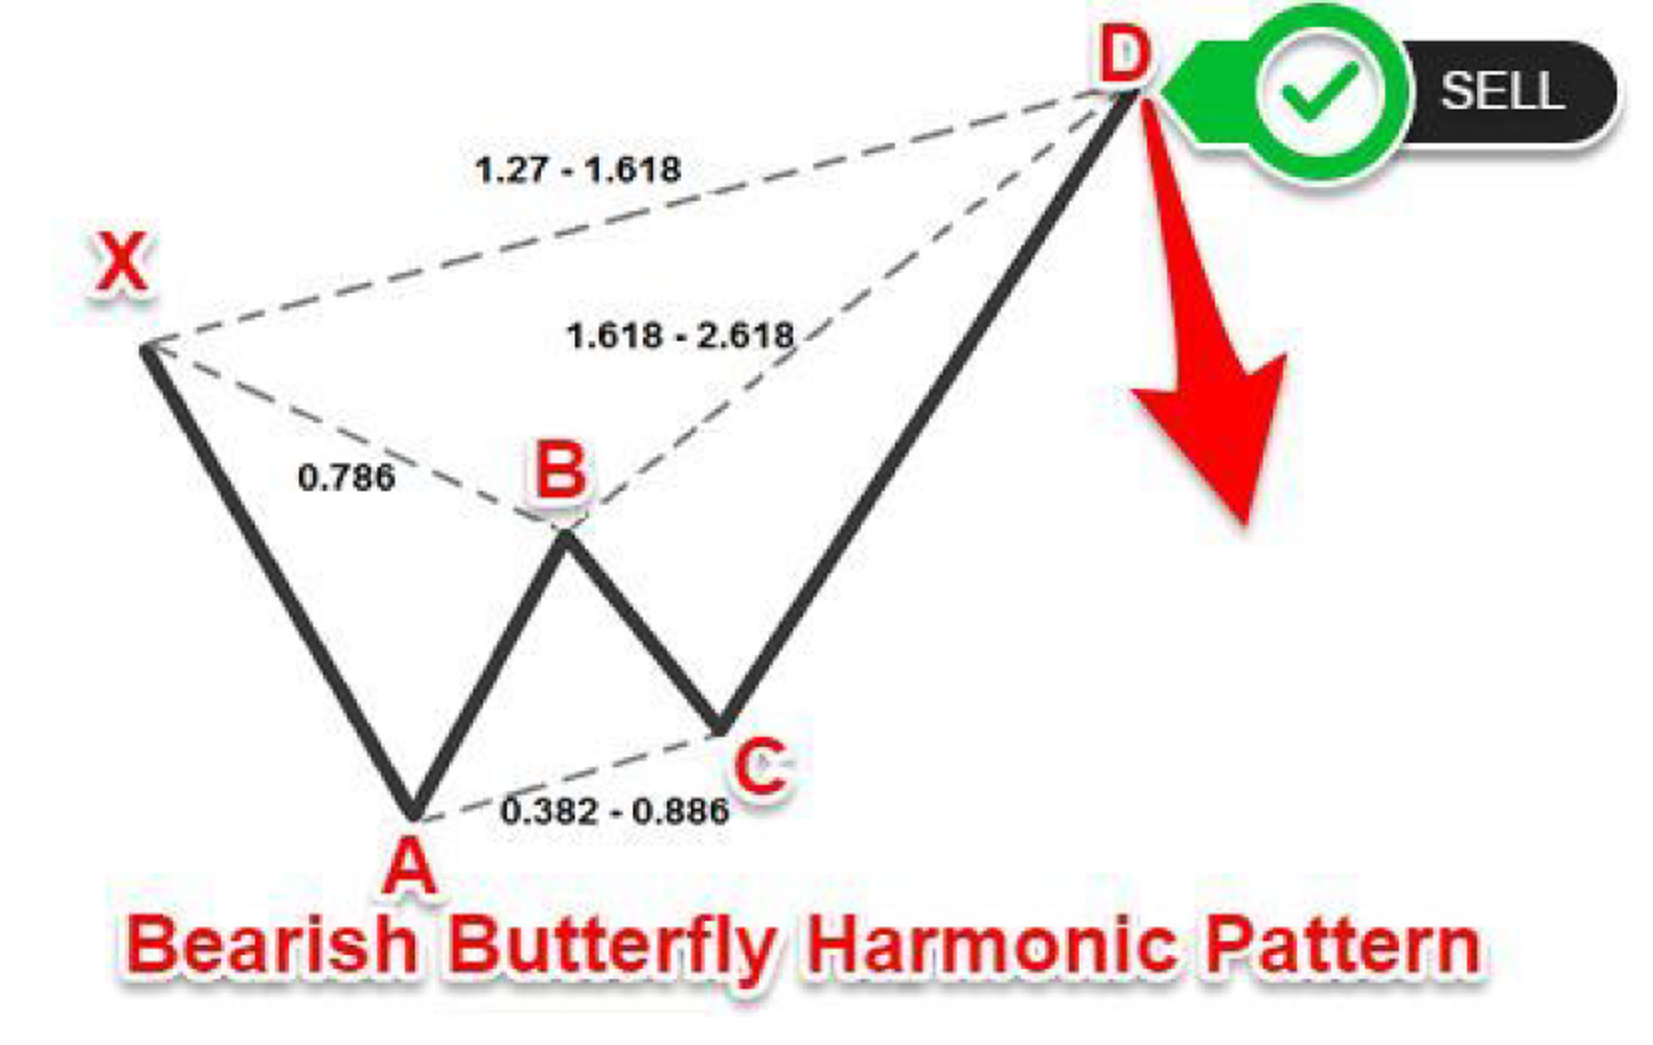
The cryptocurrency market has continued to demonstrate sensitivity to both macroeconomic signals and on-chain metrics, with traders increasingly employing technical frameworks to identify potential reversal zones. Among the major assets, Bitcoin, Ethereum, Litecoin, and Solana have each exhibited distinct price patterns that warrant careful observation. Advanced traders have been incorporating harmonic price patterns into their analysis toolkit, recognizing that structured geometric relationships can highlight areas where reversals may occur. One particularly useful pattern gaining attention is the Bearish Butterfly, a five-point harmonic formation that identifies potential downward reversal zones through precise Fibonacci geometry. Understanding how this pattern functions—and how traders monitor it—provides insight into current market analysis approaches.
The Bearish Butterfly consists of five specific points labeled X, A, B, C, and D, each with defined Fibonacci relationships. Point B retraces precisely 0.786 of the XA move, establishing the first leg of the pattern. Point C then projects outward to between 1.618 and 2.24 times the BC distance, extending the pattern and creating anticipation for a potential reversal. The pattern completes at point D, where price typically reaches a 1.27 to 1.618 extension of the original XA distance. This completion zone is considered the “Profit Taking Zone” or PRZ, where harmonic traders anticipate potential downward reversals. The geometric precision of these relationships reflects the principle that markets often move in proportional swings, a concept rooted in both technical analysis and behavioral trading patterns.
Across Bitcoin, Ethereum, Litecoin, and Solana, traders have been mapping potential Bearish Butterfly patterns on multiple timeframes to identify confluence zones where reversals might cluster. Bitcoin, as the market leader, frequently exhibits clear harmonic patterns due to its deep liquidity and established support and resistance levels. Ethereum’s increased adoption and smart contract activity have created additional on-chain data points that complement harmonic analysis. Litecoin and Solana, while exhibiting different volatility profiles, have also shown recognizable harmonic structures during recent consolidation phases. The value of harmonic patterns lies not in certainty but in probability—they identify zones where risk-reward ratios may favor sellers, allowing traders to position defensively or take profits.
Current market conditions have emphasized the importance of multi-timeframe analysis. Traders have observed that Bearish Butterfly patterns on weekly or monthly charts carry more weight than those on intraday timeframes, particularly when they align with on-chain metrics such as exchange flows, whale accumulation, or realized price levels. Bitcoin’s recent price action has been scrutinized for potential harmonic completion zones, while Ethereum traders have monitored patterns coinciding with staking developments and layer-two scaling solutions. Solana’s network activity metrics and Litecoin’s halving cycle expectations have added additional context to technical pattern recognition.
🚀 Upgrade Your Trading Experience
Join Only Signals Subscription Harmonics Pro Trader Basic Harmonics Pro Trader Intermediate Harmonics Pro Trader AdvancedWhat traders are actively watching includes the interaction between harmonic completion zones and macro-level resistance. The degree to which Bitcoin and Ethereum respect Bearish Butterfly completion areas will influence confidence in harmonic analysis broadly. Additionally, traders monitor whether reversals at these zones correspond with volume spikes, on-chain settlement, or shifts in funding rates, which would validate the harmonic framework. For those tracking Litecoin and Solana, similar confluences between harmonic zones and fundamental catalysts remain key observation points.
The cryptocurrency market continues to evolve in sophistication, with technical traders layering harmonic patterns alongside fundamental analysis and on-chain metrics. The Bearish Butterfly pattern exemplifies how geometric price relationships can structure trading decisions, even as macroeconomic factors and network-specific developments remain primary drivers of long-term directional moves. Observation of these patterns across Bitcoin, Ethereum, Litecoin, and Solana provides traders with additional context for understanding potential inflection points.